How Much Do You Really Need to Retire? A Framework, Not a Magic Number

Every few months a headline announces the number you supposedly need: one million, two million, five million. The trouble is that these numbers are averages built for an imaginary person, and nobody actually lives on an average. Two executives with identical balances can be in completely different positions, one spends $120,000 a year, and the other spends $300,000; one has a pension, and the other does not; and one owns a paid-off home while the other carries a mortgage into their sixties.
A better first question is "how much do I want to spend, and how much of it will be covered by something other than my portfolio?" That reframes the problem from a mystery into arithmetic. Your retirement number is simply the size of the portfolio that can responsibly fill the gap between your spending and your guaranteed income for as long as you are likely to need it. Once you see it that way, most of the work becomes figuring out those inputs honestly, and the inputs are things you can actually influence.
What is the framework for finding your retirement number?

Think of it as four steps you can do on the back of an envelope, then refine with better data later. First, estimate your annual retirement spending, including taxes. Second, list income that arrives no matter what the market does, such as Social Security, a pension, or rental income. Third, subtract the second from the first to find the gap your portfolio must fund each year. The fourth is to divide that gap by a withdrawal rate to get a target portfolio size.
Here is a hypothetical to show how it works, and these are made-up numbers for illustration, not a projection or a recommendation. Suppose a couple wants to spend $200,000 a year before taxes. They expect $45,000 a year from Social Security combined, which leaves a gap of $155,000. At a 4 percent starting withdrawal rate, the target portfolio is about $3.9 million. At 3.9 percent, it is about $4.0 million. Now suppose they decide they can live comfortably on $180,000 a year instead. The gap shrinks to $135,000, and the target drops to about $3.4 million. A ten percent change in spending moved the target by roughly half a million dollars, which is why spending is the most powerful lever in this entire exercise.
How do you estimate what you will actually spend?
No single number works for everyone, but a reliable way to find yours exists. Start with the annual spending you want in retirement, subtract the guaranteed income you expect (like Social Security or a pension), and divide the gap by a sustainable withdrawal rate, which many planners currently put somewhere around 3.9 to 4 percent. The result is a working target you can refine, not a finish line carved in stone.
Why is "how much do I need to retire" the wrong first question?

Most people guess by taking their current income and applying a percentage. You will often see 70 to 80 percent as a rule of thumb, and Fidelity's guidance frames it as needing savings to replace at least 45 percent of pre-retirement income after Social Security and pensions. These are useful starting points, but a high earner with a big mortgage payoff, grown kids, and a lot of savings going into retirement accounts each year might spend far less than 70 percent of their gross pay. Someone planning to travel heavily in their first decade might spend more.
A more reliable approach is to look at what you actually spend now. Pull twelve months of bank and credit card statements, and sort the spending into three groups: the essentials you cannot skip (housing, food, insurance, utilities, health care), the lifestyle spending you would like to continue (travel, dining, hobbies, gifts), and the costs that will disappear when you stop working (retirement contributions, payroll taxes, commuting, work wardrobe, possibly a mortgage).
Then adjust for the things that tend to grow, especially health care. Fidelity's most recent estimate is that a 65-year-old couple retiring today may need around $345,000 after tax over their retirement for health care costs, and that figure does not include long-term care. That is an average, not a prediction for you, but it reminds you that this is one category worth budgeting for deliberately.
It also helps to think about spending in phases. Many retirees spend more in the early, active years, a bit less in the middle years, and then more again if health care or long-term care enters the picture. A single flat number hides that shape, so it is worth sketching a rough version.
How much of your spending will Social Security cover?
For high earners, the honest answer is less than people expect. Social Security's benefit formula is progressive by design, which means it replaces a larger share of income for lower earners and a smaller share for higher earners. A Social Security Administration research article found that for people in the top fifth of earners, benefits replaced roughly a third of their earlier wages, compared with much higher rates for the lowest earners. For a senior executive earning several hundred thousand dollars a year, the benefit is capped by the taxable wage base and may cover a fairly modest slice of the lifestyle they have built.
That is not a reason to ignore it. The benefit is inflation-adjusted, lasts as long as you do, and doesn't depend on the market, which makes it one of the most valuable pieces of your income floor. Your estimate is the only one that matters, so create an account on the SSA's website and review your earnings record and projected benefits at 62, your full retirement age, and 70. The difference between claiming early and late can be large, and we'll cover that in a separate article on claiming strategy.
What withdrawal rate should you use?
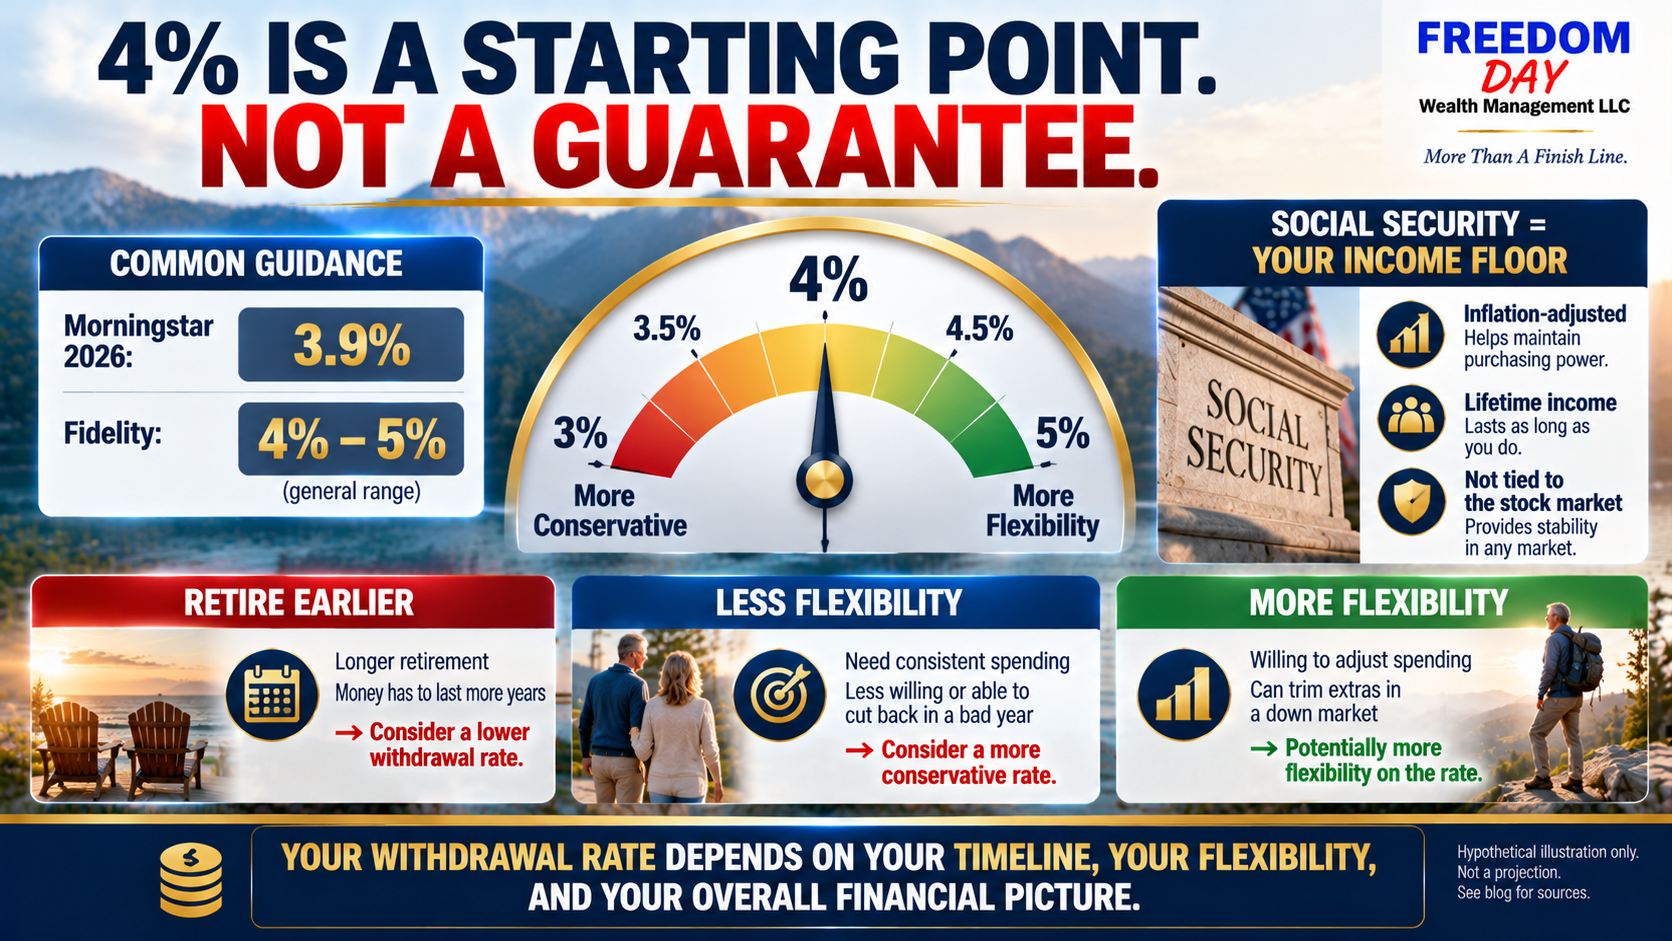
The most famous guideline is the 4 percent rule, which comes from historical research suggesting that withdrawing 4 percent of your starting portfolio in the first year, and adjusting that dollar amount for inflation each year after, would have lasted 30 years in most historical periods. It is a useful rule of thumb, but it is a starting point and not a guarantee. Morningstar's 2026 research, for example, put a safe starting rate at 3.9 percent for a 30-year retirement with a 90 percent probability of success and a balanced portfolio. Fidelity's guidance describes a sustainable range of about 4 to 5 percent. These sources are close, but they rest on different assumptions.
Several things can push your personal number up or down. A longer retirement, such as retiring at 58 instead of 67, usually calls for a lower rate. Flexibility, meaning you are willing to trim spending in a bad market year, can justify a higher one. A large income floor from Social Security, a pension, or a portion of your savings converted into lifetime income can change the picture, because less of your spending depends on portfolio returns. Think of the withdrawal rate as a dial and not a law. We will go deeper on this in a dedicated article on safe withdrawal rates.
Why do executives with equity compensation need to look at their number differently?
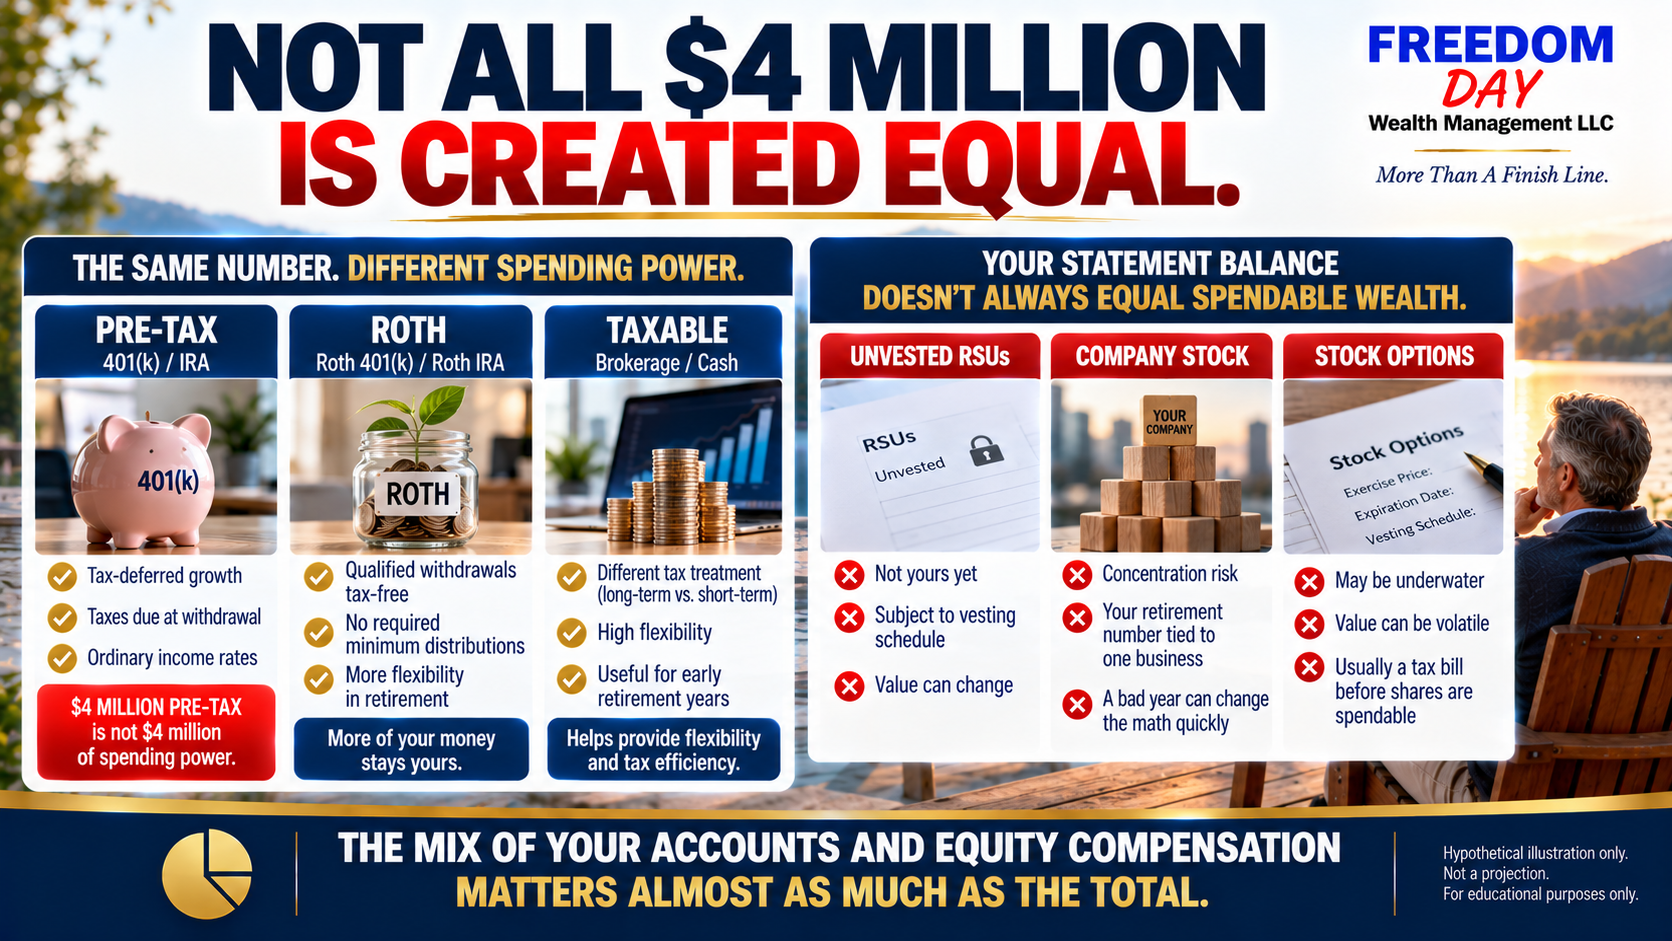
If you are a senior tech executive, your retirement number has a few wrinkles that standard calculators don't capture. First, the balance on your statement may not be the balance you can spend. Unvested restricted stock units, out-of-the-money options, and shares subject to trading windows all look like wealth on paper, but they carry risk and often trigger taxes before they turn into usable dollars. A target built on your gross equity value can be overstated by more than you realize.
The second wrinkle is concentration. If a large part of your net worth is in one company's stock, your retirement number depends on one business's fortunes, and a sharp drop around your retirement date can quickly change the math. Building a plan to diversify over time, with an eye on taxes, is part of reaching the number, not a separate topic.
The third is taxes. A $4 million portfolio is not $4 million of spending power if most of it sits in pre-tax 401(k) and IRA accounts, because every withdrawal is taxed as ordinary income. The mix of account types, meaning pre-tax, Roth, and taxable, matters nearly as much as the total. That's why we calculate the gap in our framework before taxes and then test it against the tax picture. Roth conversions, the timing of equity sales, and the order you draw from different accounts can all shift how far a given balance goes.
How do you stress-test your number?
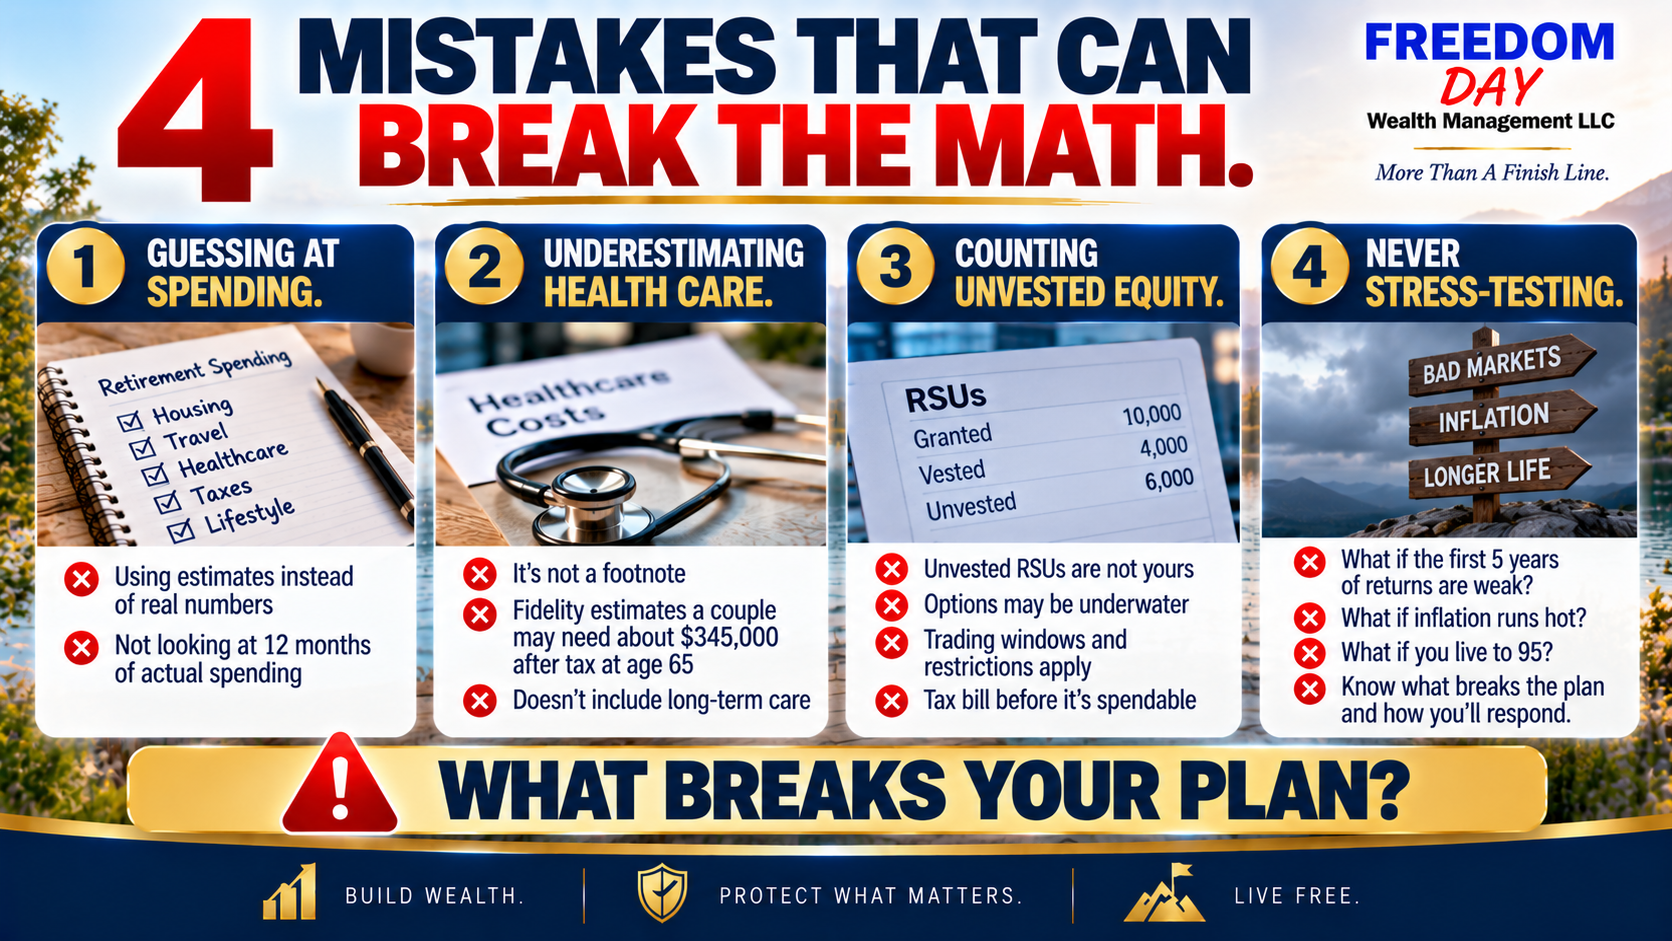
Once you have a working target, test it against what can go wrong. Run a version where the market has a rough first five years, because sequence-of-returns risk is real near retirement. Run a version with higher inflation. Run one where your spending is ten percent higher than expected, and one where you live to 95. You do not need to pass every test with room to spare, but you should know which scenarios break the plan and what you would do in response, such as trimming travel, working part-time for two years, or delaying Social Security.
The goal is not a perfect forecast. It is to learn which assumptions your plan is most sensitive to, so you can watch those and ignore the noise. As I tell my clients, a good plan is one you can follow when the news is scary, and you can only follow it if you understand why it works.
What should you actually do next?

If you are still five or more years out, put real numbers on the four steps in this article. Track your spending for a year, pull your Social Security estimate, and run the arithmetic at a couple of withdrawal rates. Then look at what is inside your balance, how much is concentrated in company stock, and how much is pre-tax versus Roth versus taxable. That alone will tell you more than any headline number.
If you are within two or three years, refine it. Build a month-by-month budget for the first year of retirement, decide how you will cover the first few years of spending if markets are down, and map out a tax plan for the years between retirement and required distributions. If you are already retired, revisit your number once a year and adjust your spending guardrails as life and markets change.
Key takeaways
- Your retirement number is a gap calculation: annual spending minus guaranteed income, divided by a sustainable withdrawal rate. It is not a universal figure.
- In a hypothetical example, cutting planned spending by 10 percent lowered the target portfolio by roughly half a million dollars, which shows why spending is the biggest lever.
- Social Security replaces a smaller share of income for high earners, but its inflation-adjusted, lifetime nature makes it a valuable income floor. Check your own estimate.
- Common withdrawal guidelines range from about 3.9 percent (Morningstar's 2026 research) to 4 to 5 percent (Fidelity), and the right rate for you depends on your age, flexibility, and income floor.
- Executives should look past statement balances to unvested equity, company stock concentration, and the pre-tax versus Roth versus taxable mix, since each changes how far a balance really goes.
- Stress-test the plan against weak early returns, higher inflation, higher spending, and a long life, then decide in advance how you would respond.
Frequently asked questions
Is $1 million enough to retire?
It depends entirely on your spending and other income. At a 4 percent withdrawal rate, $1 million supports about $40,000 a year before taxes, plus Social Security. For someone who spends $200,000 a year, it is nowhere near enough, and for someone with a pension and modest spending, it might be plenty. The framework in this article gives you a way to answer it for your own situation.
Is the 4 percent rule still reliable?
It remains a reasonable starting point, but it is a guideline, not a guarantee. Morningstar's 2026 analysis landed at 3.9 percent for a 30-year retirement under specific assumptions. Your personal rate may be lower if you retire early, or higher if you are flexible with spending and have a strong income floor.
Should I count my home equity in my retirement number?
Most planners leave it out of the core calculation, because you need somewhere to live. It can serve as a backstop, for example by downsizing later, but relying on it to fund day-to-day spending adds risk and depends on housing markets and your willingness to move.
How much should I plan for health care?
Fidelity estimates that a 65-year-old couple retiring today may need about $345,000 after tax in health care costs over retirement, excluding long-term care. Your own number depends on your health, where you live, and your income, since higher income can raise Medicare premiums. Budget for it deliberately rather than treating it as a footnote.
Do I need to replace my full salary in retirement?
Usually not. Work-related costs, retirement contributions, and payroll taxes go away, and many people spend less over time. But rather than applying a percentage, it is more accurate to build your retirement budget from your actual spending.
When should I get help calculating my number?
Anytime, but especially within about ten years of retirement, when equity compensation, taxes, Social Security timing, and withdrawal strategy all start to interact. A second set of eyes can catch assumptions that a calculator will not.
About Jeff Kikel
Jeff Kikel is the founder of Freedom Day Wealth, a fee-based wealth and retirement planning firm that helps senior professionals and executives turn a career's worth of equity compensation and savings into a confident, well-planned retirement. Jeff writes and speaks in plain language because he believes people make better decisions when they actually understand what is happening with their money. His approach is simple: explain the tradeoffs honestly, keep the focus on the long term, and always circle back to what you should actually do next.
If you are trying to figure out what your own retirement number looks like, Freedom Day Wealth can help you map it out alongside your equity compensation and your retirement timeline. You can learn more at www.FreedomDayWealth.com.
Jeff is a prolific author of over 20 books on Finance, Retirement, and Entrepreneurship. You can find more on Jeff's Amazon Author Page
This article is for educational purposes only and is not investment, tax, or legal advice. Every situation is different, and the rules and dollar limits referenced here can change. Please consult a qualified financial or tax professional, and review your own plan documents, before making decisions about your retirement target and withdrawal strategy.
Sources
- Fidelity: Retirement planning guide (savings guidelines and income replacement)
- Fidelity: How to prepare for health care costs in retirement
- Morningstar: What's a Safe Retirement Withdrawal Rate for 2026?
- Social Security Administration: Alternate Measures of Replacement Rates for Social Security Benefits and Retirement Income
- Social Security Administration: Retirement Estimator