Pullbacks Are Normal. Here's How Often the Market Actually Falls.
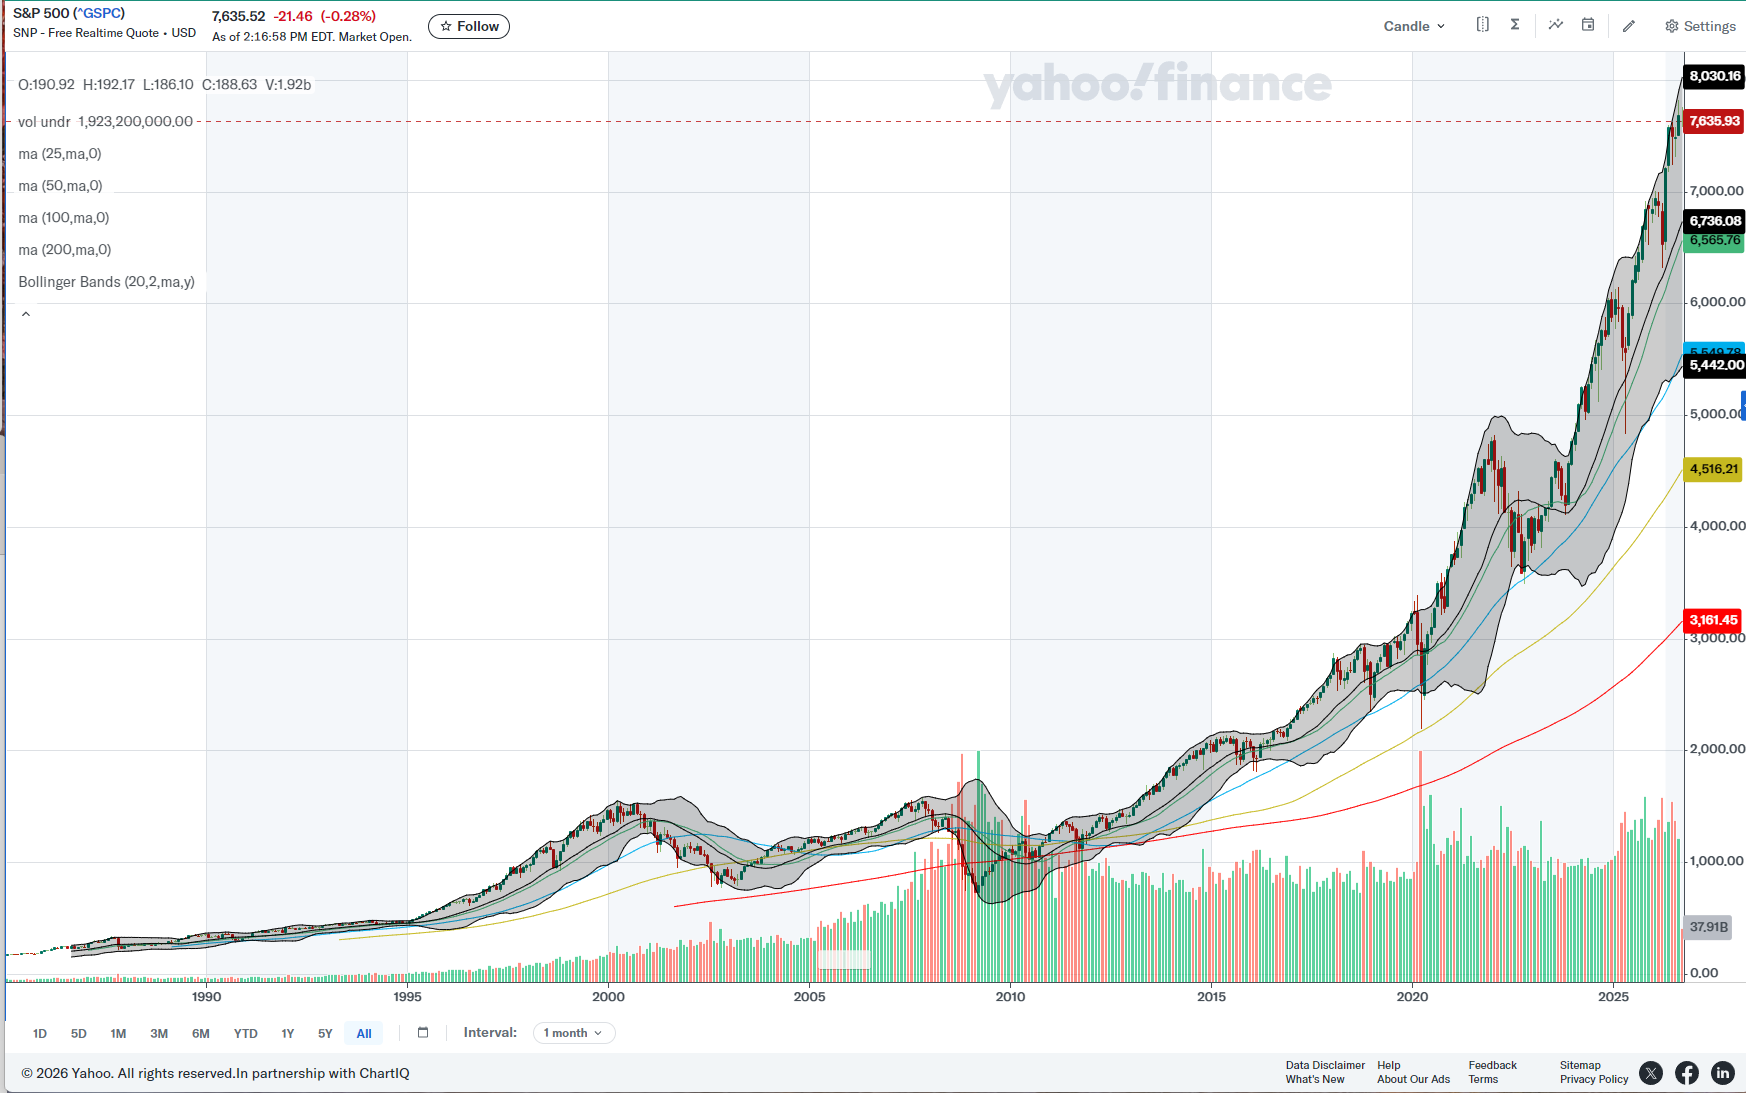
The stock market goes up in about seven out of every ten years, and yet it almost never gets there in a straight line. History suggests expecting a handful of small dips every year and a bigger one every couple of years, with September and October usually the roughest stretch. That is not a reason to panic. It is a reason to stay diversified and keep your head, especially with so much of this market riding on a small group of AI names. Here is how I would frame the next few weeks.
Ron and I taped this one right after Labor Day, when the market tends to wake up from its summer nap, and everyone suddenly remembers that stocks can go down. We spent the show pulling apart a few charts, and the thread running through all of them was the same: the market has always been bumpy, and the smart move is to plan for the bumps rather than be shocked by them. Let me walk you through it.
How often does the market actually pull back?
This is the chart I wish every investor had taped to their monitor. Since 1980, the market has averaged at least three separate 5 percent pullbacks every year. A deeper 10 percent drop has shown up roughly every 12 to 16 months. And a real gut-check decline of 15 to 20 percent has arrived about every 24 to 36 months. Read that again and let it sink in. Falling 5 percent a few times a year is not a crisis. It is the price of admission.
We have already seen it in 2026. Earlier this year, the market dropped about 5 percent very quickly, then turned around and climbed to roughly 15 percent up at the peak. Last year told a similar story: a sharp scare in the spring that resolved in about six weeks, and then the year finished up 16 percent. The pullbacks were real, and so were the recoveries. If you bailed during the dip, you missed the part that mattered.
So why do September and October feel so shaky?
Because historically they are. September and October have long been the two weakest months of the year for stocks, and we may well revisit some of those lower levels this month and next. I want to be careful here: that is a tendency, not a prophecy. Plenty of Septembers have surprised to the upside, and the market owes history no particular outcome. But if the next few weeks get choppy, you should not be surprised, and you definitely should not let a seasonal wobble talk you out of a long-term plan.
I bring up seasonality not to scare you. It is the opposite. When you know that a rough autumn is normal, a rough autumn stops feeling like an emergency. It becomes background noise, and sometimes even an opportunity to put money to work at better prices.
The part that actually worries me: what's under the hood
Here is where I would spend my attention. A relatively small group of enormous AI-driven companies is carrying this market, and one of Ron's charts showed how much debt those names are taking on relative to their assets. The top-tier players, the ones throwing off real profits, can carry that debt comfortably. Oracle borrowed what looked like an obscene amount to keep up, and even a giant like IBM has been playing catch-up, but those companies have the revenue and the assets to support it.
My concern is the second tier. Some of the smaller and mid-size names, including a few former Bitcoin miners trying to rebrand as data-center companies, are loading up on debt to stay in the game. That works fine as long as the money keeps flowing and the economy holds. But debt is an anchor. If the economy softens for a sustained stretch and revenue isn't there, that anchor can pull a company under, and the ones most at risk are exactly the ones that borrowed the most to chase the trend.
What about the Fed and interest rates?
This is the other piece keeping the market on edge. The futures market has been pricing in more than a 50 percent chance that the Fed will raise rates, which would be unusual this late in a cycle. My read is that the Fed will most likely hold. The last employment report was solid, with unemployment sitting right around 4.1 percent, which is almost exactly where the Fed wants it. They are comfortable on the jobs side. Their headache is inflation, and a lot of that is really an oil story rather than a broad price story.
If I am wrong and they do hike, do not be shocked to see the market throw a short-term tantrum. That kind of surprise can trigger one of those garden-variety pullbacks we just talked about. It would be noise, not a reason to abandon a sound plan.
Is the latest inflation scare even real?
Honestly, this week it was mostly a nothingburger. The financial media went into a frenzy over the producer price report, and it came in at 0.4 percent, exactly what forecasters and the consensus expected. No surprise at all. The consumer price number was expected to land in the same neighborhood. The market has been in a bit of a panic loop lately, treating in-line data like a shock, largely because the Fed has not given clear signals about where it is headed.
The real inflation right now is concentrated in oil and diesel. It is easy to blame Iran, but the bigger driver is that Ukraine has been hammering Russian oil infrastructure and recently knocked out a major Black Sea terminal. Most diesel comes out of the Black Sea, not the Persian Gulf, so that conflict is showing up at the pump more than any single headline suggests. It is worth understanding, because it shows this inflation bump is more about war than a runaway economy.
So what does this mean for a long-term investor?
A few plain thoughts. First, expect pullbacks and stop treating them as emergencies, because three small dips a year and a bigger one every couple of years is simply how this works. Second, respect the calendar but do not trade on it: September and October are historically weak, so brace for bumps without bailing. Third, know what you own, because owning the market today means owning a big bet on a handful of AI names, and you want real diversification beyond the crowded, debt-heavy trade. Fourth, don't let an in-line inflation print or a Fed meeting rattle you. As I tell my clients, the goal is not to predict the next dip. It is to stay invested, stay diversified, and make sure you are being paid fairly for the risk you take. None of the above is a recommendation for your particular situation, it is simply how I am reading the week.
Frequently asked questions
How often does the stock market pull back?
Historically, since 1980, the market has seen at least three 5 percent pullbacks a year, a 10 percent drop about every 12 to 16 months, and a 15 to 20 percent decline roughly every 24 to 36 months. Dips are normal, not rare.
Are September and October really bad for stocks?
They have historically been the two weakest months of the year. That is a tendency, not a guarantee, so it is a reason for steady expectations rather than a trading signal.
Should I sell before a pullback?
Trying to time the exit usually backfires, because the market rises in about seven of every ten years and the recoveries often come fast. Staying invested and diversified tends to beat jumping in and out.
Why is so much of the market riding on AI stocks?
A small group of large AI-driven companies is producing much of the market's growth. That has powered strong returns, but it also means your index fund is quietly carrying a big, concentrated bet on those names.
Is inflation heating up again?
The latest producer price data came in at 0.4 percent, right in line with expectations. The real pressure is concentrated in oil and diesel, driven partly by attacks on Russian oil infrastructure, rather than a broad-based surge.
The Bottom Line
The market goes up most years, but it never does it smoothly. Expect a few 5 percent dips a year and a deeper one every couple of years, expect September and October to be bumpy, and expect the occasional Fed or inflation scare to rattle nerves. None of that is a reason to run. The real work is knowing what you own, staying diversified beyond the crowded AI trade, and keeping your composure when the headlines get loud. If you want this kind of plain-English read on the market every week, subscribe to The Cents of Things.
Source: per The Cents of Things market review recorded September 10, 2026, historical data since 1980 shows at least three 5 percent pullbacks per year, a 10 percent pullback every 12 to 16 months, and a 15 to 20 percent pullback every 24 to 36 months, with the producer price index for the month reported at 0.4 percent, in line with consensus.
About the author
Jeff Kikel is a 30-year financial professional and the founder of Freedom Day Wealth Management, a fee-based wealth and retirement planning firm, and Profit Pilot Tax and Financial Services, a tax strategy and business-exit practice. He helps business owners and high earners build wealth, exit their businesses well, and retire on their own terms. Want help applying any of this to your own plan? Reach Jeff through Freedom Day Wealth Management at www.FreedomDayWealth.com or Profit Pilot at www.ProfitPilotTax.com.
This is for education only and is not investment, tax, or legal advice.